Measuring Freshness with Synthetics
12/20/2024
Measuring SLIs for web endpoints is straightforward, but not everything is a synchronous request. In this post we'll look at tracking freshness in a data pipeline with synthetic monitoring.
It often surprises me how many applications boil down to moving data from one place to another, maybe with a little processing along the way.
In this post, I’ll look at the concept of “freshness” metrics for data pipelines, and tell the story of how we measured this at a company with data pipelines in abundance.
When you’re putting data through a complex, unattended pipeline, there’s a lot that can go wrong. A step somewhere in the middle could fail and drop some data silently, a single account could send a ton of updates at once causing delays for everyone else, or a bug could cause the results to be just plain wrong.
Focusing on the problem of delays, the Google SRE book describes the concept of a “freshness” SLO. This can be represented in a few different ways, such as an expectation that most data can be processed in a certain amount of time.
A challenging landscape
A couple of years ago, I was leading an SRE group that was wrestling with this problem. Changes to customer data would result in a huge number of events fanning out to many different pipelines.
The code powering these pipelines varied in age from a few months to a decade or more and was owned by over twenty separate teams, so trying to instrument all these paths seemed like a herculean task.
We needed a more generic way to catch issues with freshness, ideally without requiring teams to make significant changes.
It wasn’t all bad news, though. The majority of pipelines were triggered in response to changes of a common “entity” type, and these Entities supported custom fields that could be rendered as-is in the final output.
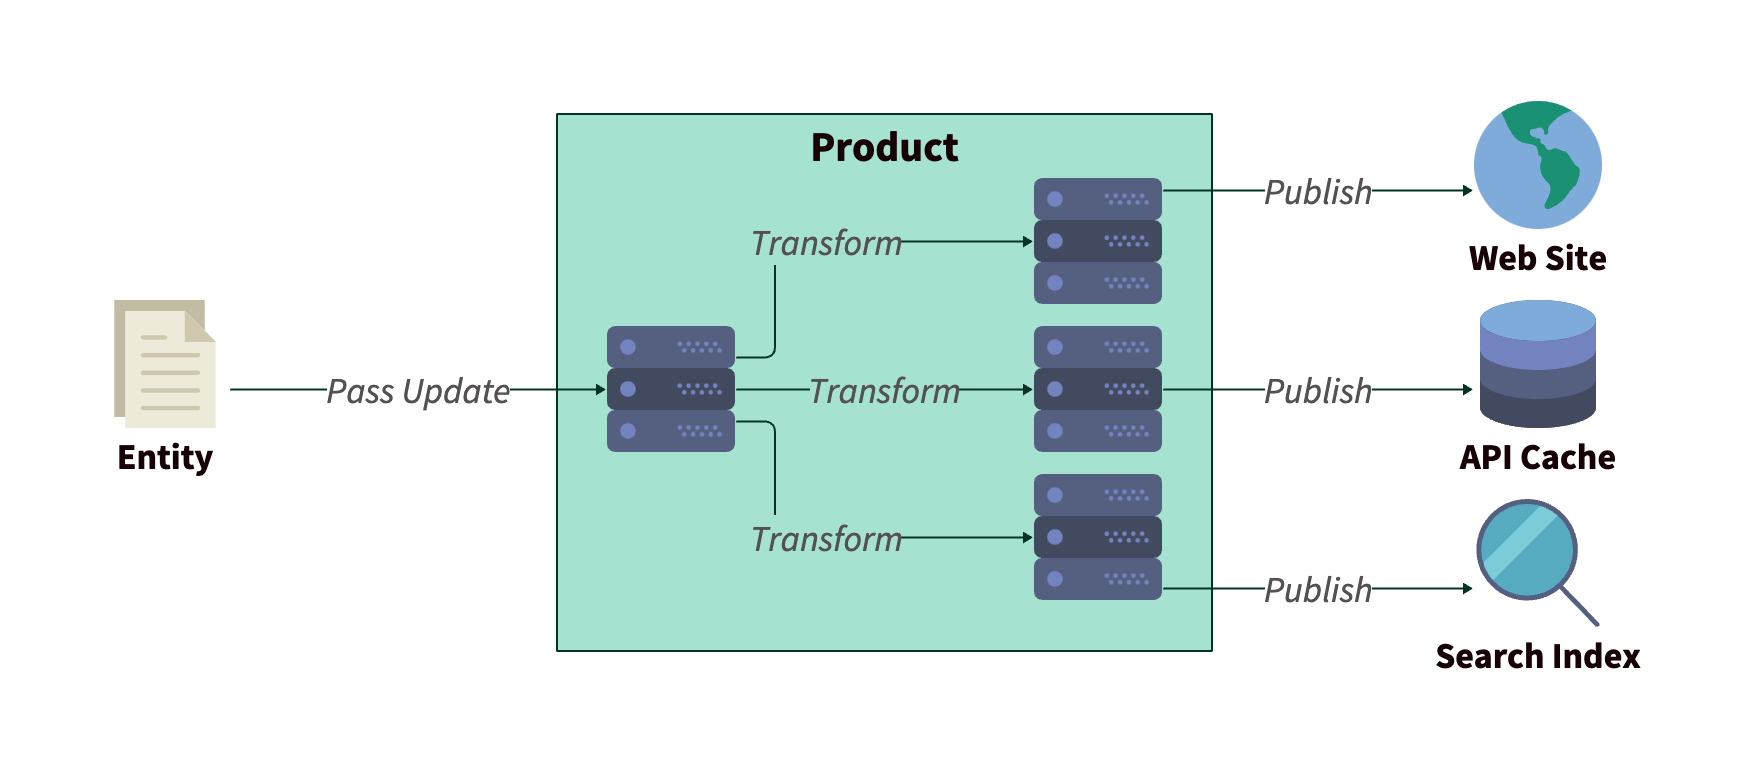 Flow of entity data through the product
Synthetics to the rescue!
Rather than try to capture every update hitting the pipelines, or sampling a subset, we introduced a “tracer” entity as a proxy for the overall performance of our systems.
We’d recently onboarded Checkly as a synthetic monitoring solution, and this seemed like a perfect use case for our shiny new tool.
Our tests were constructed in two parts. An “update” check firing every minute to modify the tracer entity with the current time, and a “result” check on the other side monitoring the output. The timestamp in the output would be checked against the current time to estimate the update latency.
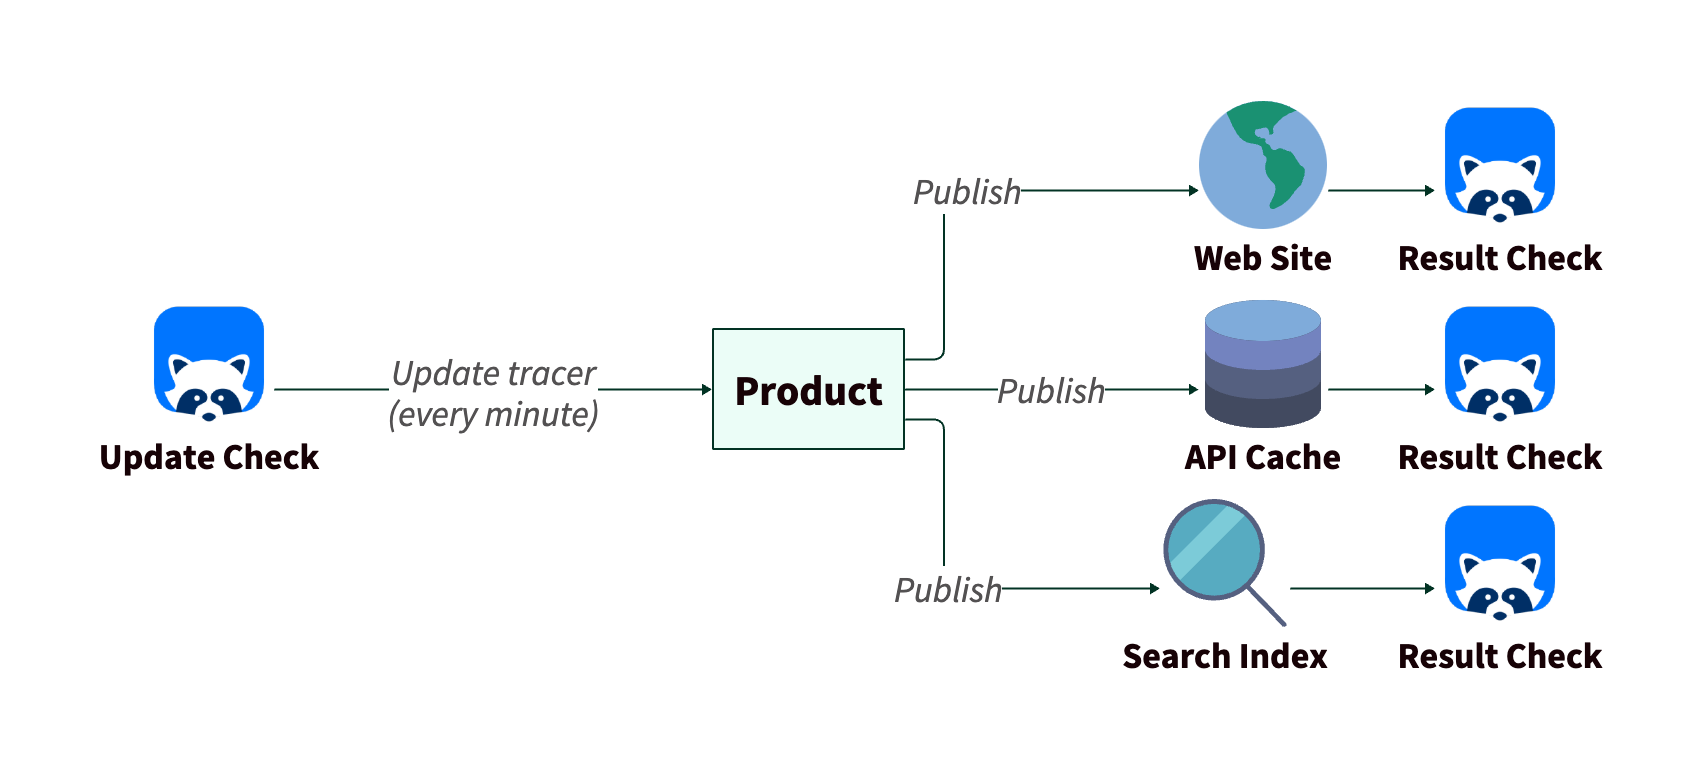 Flow of tracer data and checks
Each result check would have a threshold for acceptable latency, above which an alert would fire. For eventual consistency of our API cache, for example, we could tolerate up to a 15 minute delay.
This approach turned a potentially painful, long-running project and turned it into an exercise a single person was able to do over a few weeks. The only specialist knowledge required was an understanding of how to use our products.
All of a sudden, we had visibility into performance that we’d only been hearing about anecdotally before. At first, alerts were pretty frequent, but we quickly saw things stabilize as teams identified bottlenecks and shored up their testing. We even raised the bar, bringing down our latency thresholds in a few areas.
What this could, and couldn’t tell us
As with all synthetic monitoring, these checks were able to tell us when something was wrong, but couldn’t guarantee that everything was working across the board. It would have been easy to miss latency issues affecting a specific customer, or involving an edge case.
Also, as a “black box” test, the checks gave us a signal for a symptom, but we still needed to dig into the inner workings of our pipelines for the cause.
So we still needed high-quality instrumentation of each pipeline and there was potential benefit to gathering more aggregate data for performance. But having a synthetic in place fixed the “hair on fire” problems with broad latency issues, and gave us a little more insight into patterns, both buying time for other solutions, and informing what they should be looking at.