Is GitHub getting less reliable?
2/13/2026
It's been a bad couple of weeks for GitHub reliability, but how does this compare to their previous performance? I pulled some data from their status page to find out.

The past two Mondays in a row, I’ve heard of teams blocked by GitHub outages. Problems ranged from GitHub Actions timeouts to failures in basic Git operations. There has been a lot of speculation for the systemic cause of this incident uptick. An increase in AI-generated code is an easy theory to grab hold of, but a more tangible smoking gun could be GitHub’s current priority to migrate to Azure. Putting aside the why for a moment, how bad is it really at the moment? And how does it compare to GitHub’s performance in the past?
Like many companies, GitHub has a public status page to keep users updated on known issues and steps being taken to deal with them. I’ve previously held this up as an example of a “loud” status page. “Feeling bad about the number of incidents you’re reporting? See how many GitHub post!”. This can be seen both in a positive and a negative light. Sure, GitHub’s product range experiences a lot of issues, but at the same time, they’ve been great at detecting and reporting on them. Many of the issues posted either have a low severity or a small blast radius, and in my experience as a GitHub user, I’ve rarely actually been impacted directly.
Helpfully, the status page maintains full history, so I figured I might as well scrape it! They didn’t even rate limit me when I did so. Armed with full details of all GitHub’s reported incidents for the past few years, I parsed and organized them into a few csv files and started drawing some graphs.
As a first step, I took a look at weekly incident counts for the past year:
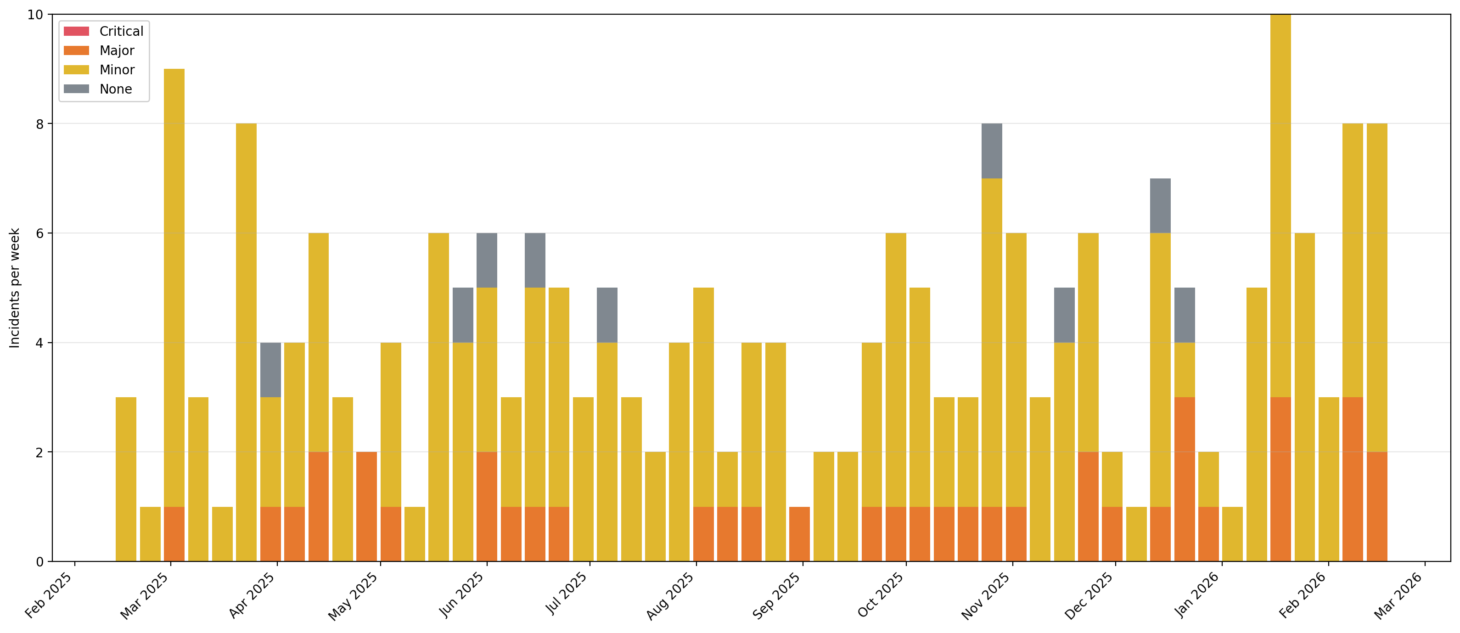 Incidents per week, organized by severity
In this view, the past couple of weeks look high overall, but not shockingly so. We even see a similarly bad week appearing more or less a year ago. Looking at the orange “Critical” incidents, though, we can see that we’re definitely in a period of more impactful incidents. It’s a modest increase though (given the small numbers overall), so why do we feel like things are so much worse right now? There must be another way to slice the data!
One key difference with Monday’s outage was how broad it was, affecting a number of GitHub’s products. On the status page, these are called “components”. To take into account the “breadth” of each incident, I counted each component as a separate incident.
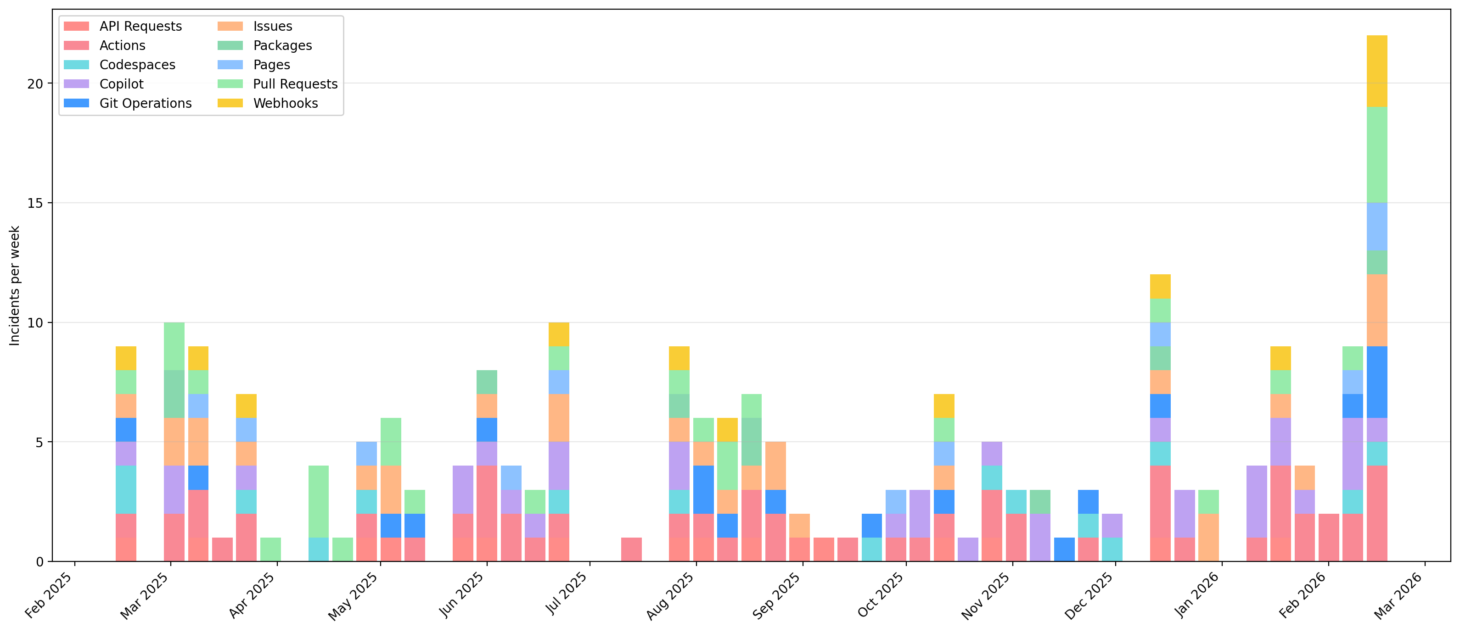 Component-incidents per week
Now we’re getting somewhere! This past week included significantly greater cross-component impact than we’ve seen across the past year. I wondered if GitHub had ever seen this bad a week before, so expanded back over 5 years, adding a few bells and whistles to the chart while I was at it.
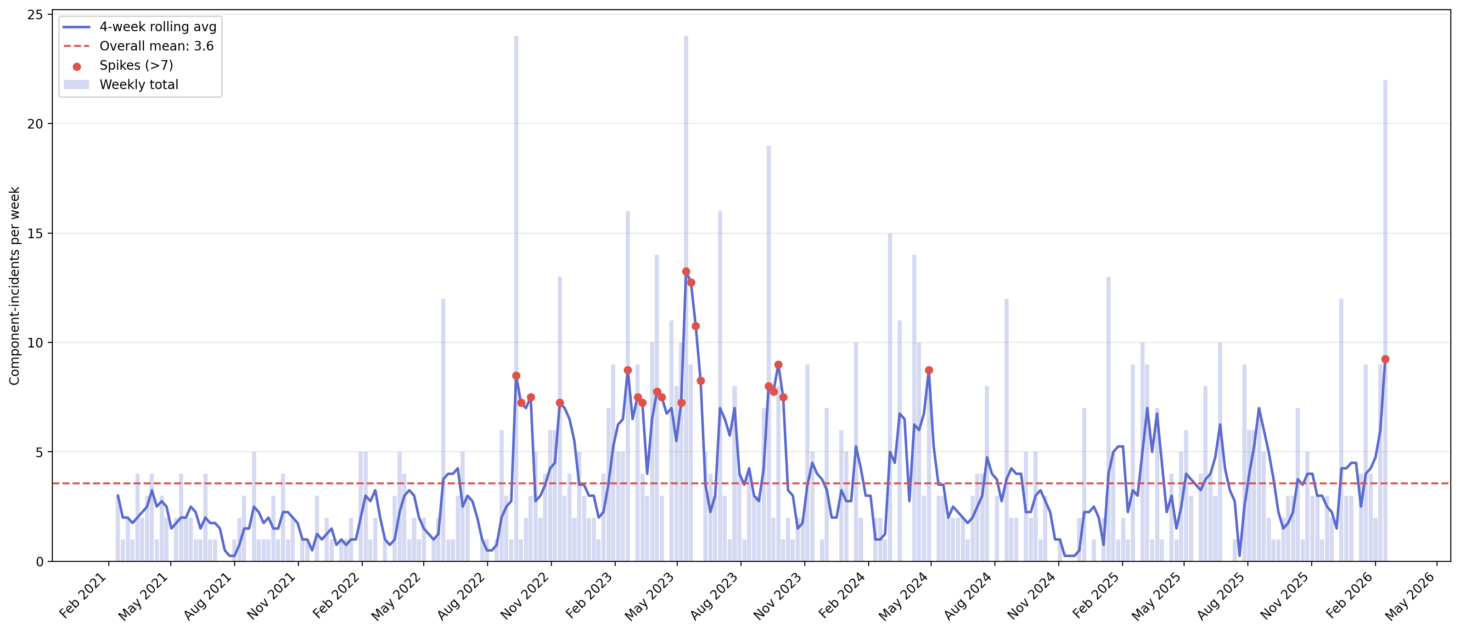
The last comparably bad week for incidents was back in May of 2023, and sure enough, GitHub issued a blog post around this time addressing the issues. Looking at the spikes on the weekly average (red dots), 2023 overall was a rough period. Could we be due for another bad year? Maybe, maybe not. The monthly availability report for January should be coming out over the next few days on the GitHub blog, but February’s won’t be out until mid-March. I’ll be keeping an eye out for it for sure.
Of course, this analysis is just looking at raw numbers and doesn’t dig into the described impact or root causes, which would add more color to the counts. But it has been interesting to see the overall trends, and it’s an exercise I’d be inclined to repeat when evaluating new vendors.